Thinking Maps® are visual representations for different thought processes. They’ve been around for decades, but are a BIG deal in some districts right now, so I wanted to go over a few ways to use Thinking Maps® in science.
I learned about Thinking Maps® for the first time a few years ago and reluctantly started implementing them in my classroom. I should have never been afraid! Students get used to using them K-5 and become pros at making connections, describing, comparing and contrasting, classifying, showing parts of the whole, and determining causes and effects.
I’m not remotely close to an expert on science Thinking Maps® and I recommend you visit the official website to learn more and receive the official training. Being trained is really important. I’ve had training and still struggle sometimes.
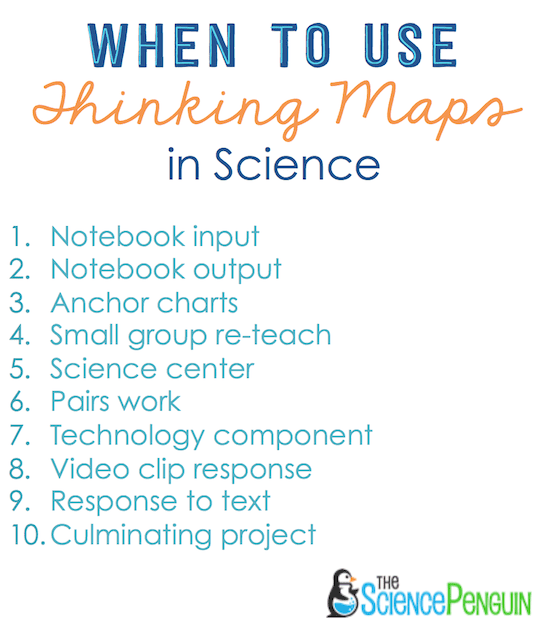
When can you use Thinking Maps® in science?
We most often use Thinking Maps® during notebooking lessons for input or output, but there are many ways to utilize these tools!
There are 8 types of Thinking Maps®.
Circle Maps
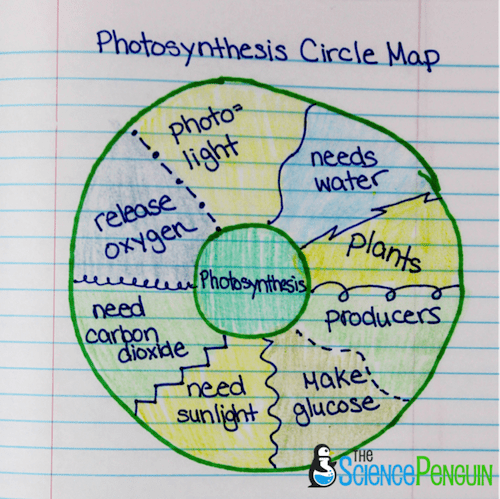
A Circle Map is a classic go-to for students to brainstorm, define terms, or write everything they know about a topic.
Examples:
1. write everything you know about photosynthesis
2. define thermal energy
3. identify nonrenewable resources
Bubble Map
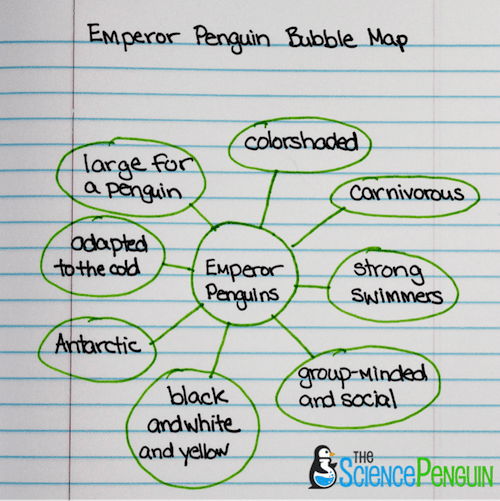
Students use Bubble Maps to describe properties or characteristics of an object or concept. You mainly use adjectives and adjective phrases.
Examples:
1. describe a penguin
2. describe properties of a solid
3. provide qualities of hydroelectric energy
Double Bubble Map
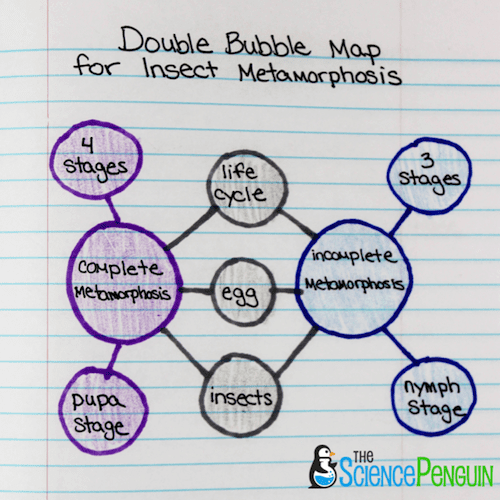
The Double Bubble is used for comparing and contrasting two topics.
Examples:
1. compare and contrast incomplete and complete metamorphosis
2. identify similarities and differences between the moon and Earth
3. compare and contrast plants and animals
Tree Map
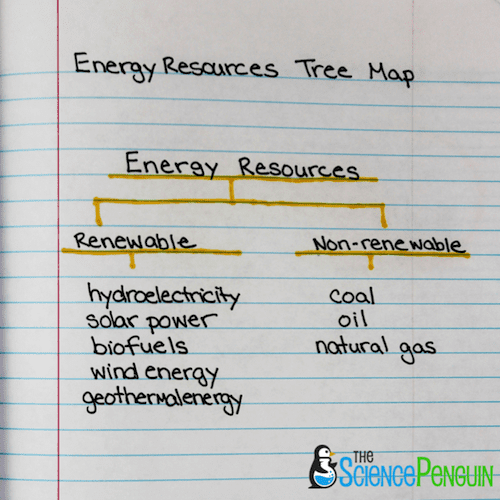
A Tree Map is used to classify objects, ideas, or topics.
Examples:
1. classify natural resources as renewable or non-renewable
2. group materials as conductors or insulators of electricity
3. classify organisms as plants or animals
Flow Map
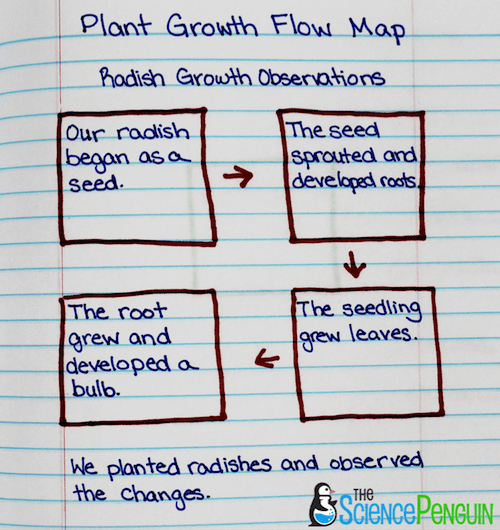
Students use Flow Maps to sequence events.
Examples:
1. record changes in the growth of plant over the course of a month
2. sequence the steps in the formation of coal
3. describe the transfer of energy in a food chain
Multi-Flow Map
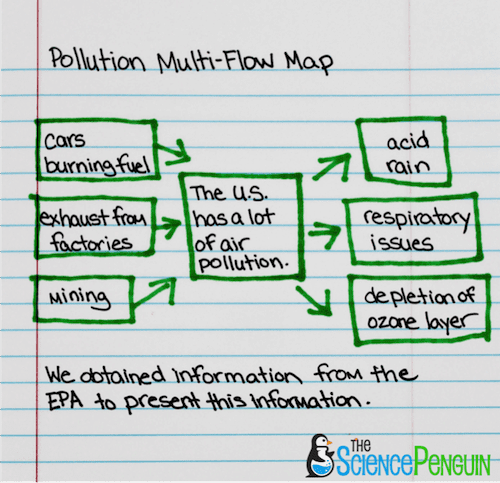
Multi-Flow Maps show causes of an event and the effects of that event. The event must be something happening.
Examples:
1. What causes air pollution in the United States and what are the effects?
2. What has caused a shortage of honey bees and what are the possible effects?
3. Why does the United States rely on fossil fuels and what are the possible effects?
Brace Maps
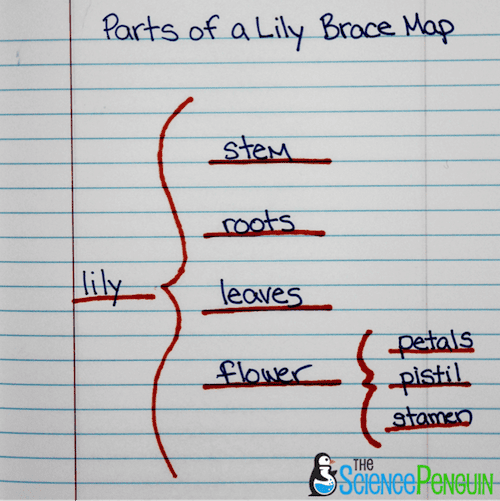
When you use a brace map, you break larger objects into smaller parts or show parts of a whole.
Examples:
1. identify the parts of the digestive system and the smaller parts within that system
2. identify the parts of a flower and their subparts
3. identify the parts of an atom
Bridge Maps
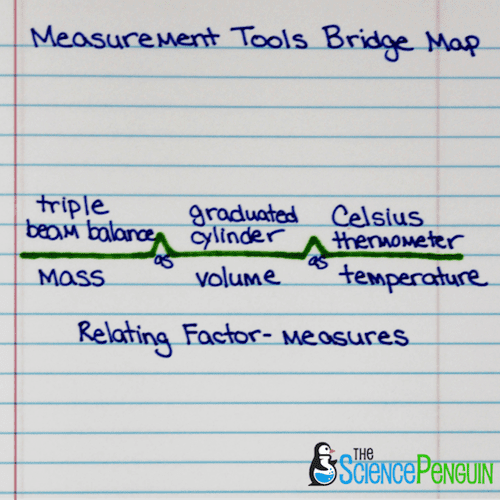
Bridge Maps help students show relationships between ideas. The top and bottom have a relating factor.
Examples:
1. describe the solid and liquid forms of matter
2. identify the length of the cycles for cycles in space
3. identify measuring tools and what they measure
Thinking Maps® have been effective tools for me and my students. If they are new to you, I encourage you to give one or two a try. My “go-to” maps are Circle Map, Double Bubble, Bubble Map, and Tree Map. The Multi-Flow Map requires students to use their brains. Give it a try!


13 thoughts on “Science Thinking Maps”
I love your site! I teach 4th and 5th grade science in North Carolina and use a ton of your ideas.
Just noticed that Laura Candler pinned this post…muy impressive!
Our county implemented thinking maps 9 or 10 years ago. This is going to give them a fresh life in my room!
LOVE these ideas! They are quick, and something that students can easily replicate on their own as note-taking/note-making strategies. THANK YOU!
Jenny
Love that you are using Thinking Maps! As a Thinking Maps Teacher and Trainer I have to tell you the Brace, Multi-Flow, and Flow Maps should be revised. Great job making other teachers aware of Tbinking Maps! Feel free to email me
*Great job making other teachers aware of Thinking Maps!
I emailed you. I want to make sure these examples are correct!
Great post! In cognitive science you can find much more about this!
scienceddicted.blogspot.com
🙂
Thank you for taking the time to put this together, it was extremely helpful!
Thanks, Kristen!
Great and helpful ideas! Thank you for sharing~
Thanks for sharing the wonderful ideas. Indeed they help me a lot!
Hi! Would you have kids pick one of these to show/organize the information they are learning or would you choose one & go through it with them together?
Choose one together most of the time
Thank you Jamia
i have loved the concept of teaching maps.
Kindly share with me what needs to be revised on the Brace, multi-flow and Flow maps.
i will be grateful
Regards
Stephen Mbasani – Uganda
Comments are closed.